Keep "What You Actually Own When You Buy the Index.
Jermaine Carter · · 14 min read
Our shorter piece made a narrow claim: buying an index fund is not a neutral act. It is a decision to own the market exactly as it is currently built. This is the longer version of that argument — including the parts that cut against us.
We want to be clear at the outset about what this is not. It is not a case for abandoning index funds, and it is not a pitch for stock picking. The evidence against most active management is strong, we take it seriously, and index funds do most of the work in most of the portfolios we build. The question we are raising is different: once you have decided to own the market, you have still not decided how to own it — and for households approaching or already in retirement, that second decision does real work.
The evidence for indexing, stated fairly
S&P Dow Jones Indices publishes the SPIVA Scorecard, which compares active fund performance against the appropriate benchmark. The Year-End 2025 report found that 79% of active large-cap U.S. equity funds underperformed the S&P 500 for the year, up from 65% in 2024, and the fourth-worst showing for large-cap managers in the study's 25-year history. Extend the window and the picture gets harder for active management, not easier: over 20 years, roughly nine out of ten domestic funds trailed their benchmarks.
The companion Persistence Scorecard is arguably more damaging. Of the funds that finished in the top half of their category in 2021, very few stayed in the top half over the following four years. For large-cap funds, persistence came in below what random chance would produce.
That last finding is the one that should shape behavior. It means the practical problem is not whether skill exists somewhere in the industry. It is that identifying it in advance, from a track record, is close to a coin flip — and a coin flip with a fee attached.
Why the result is structural, not a phase
It helps to understand why the SPIVA numbers look the way they do, because the reason is arithmetic rather than fashion.
All the shares of U.S. stock are held by someone. The market's return is the weighted average return of all its owners. Index investors, by construction, earn that average minus a very small fee. Everyone actively trying to beat it must therefore, in aggregate, also earn the average — minus much larger fees and trading costs. Active management is close to a zero-sum contest before expenses, and a negative-sum one after. This was John Bogle's actual argument, and William Sharpe's, and it does not depend on markets being efficient or on any particular asset pricing model being correct. Markets could be riddled with mispricing and the arithmetic would still hold.
That is why "the theory behind indexing has holes in it" is a weaker objection than it sounds. The cost-and-arithmetic case survives even if every academic model behind it is wrong.
What SPIVA does not measure
Taking evidence seriously means reading it precisely. Three limits are worth naming.
It measures funds, not portfolios. SPIVA compares a manager's security selection against a benchmark. It says nothing about asset allocation, withdrawal sequencing, tax location, rebalancing discipline, or whether a household's portfolio is aligned with its actual liabilities. Those decisions typically matter more to a retirement outcome than which large-cap fund was selected, and none of them appear anywhere in the scorecard.
Methodology is contested. In 2026, a study sponsored by the Investment Adviser Association's Active Managers Council argued that SPIVA's construction understates active fund results. We do not find the critique strong enough to reverse the conclusion — the gap is too wide and too persistent across too many windows. But readers should know the debate exists rather than encountering it later as a gotcha.
Benchmark choice drives the headline. The 2025 figure reflects a year in which the S&P 500 outpaced the S&P MidCap 400 by roughly ten percentage points and the SmallCap 600 by twelve. Any manager holding meaningful mid- or small-cap exposure was fighting the benchmark's composition, not just losing to stock selection. Underperformance and poor judgment are not the same measurement.
None of this rehabilitates active management. It does mean the honest summary is narrower than the slogan: paying up for security selection has been a losing proposition, reliably and across decades. That is a strong claim. It is not the same claim as the cap-weighted S&P 500 is the correct equity allocation for every investor at every point in time.
Cap weighting is a rule, and the rule has consequences
A market-cap-weighted index buys more of a company as its price rises, and less as it falls. There is nothing sinister in that — it is the mechanically correct way to represent aggregate market value, it keeps turnover and cost low, and it is the reason index funds work as well as they do.
But it means position sizing inside the fund is set by price, not by valuation, earnings quality, or diversification. When capital concentrates into one theme, the index concentrates with it. Automatically, and by design.
Here is where that stands as of this writing.
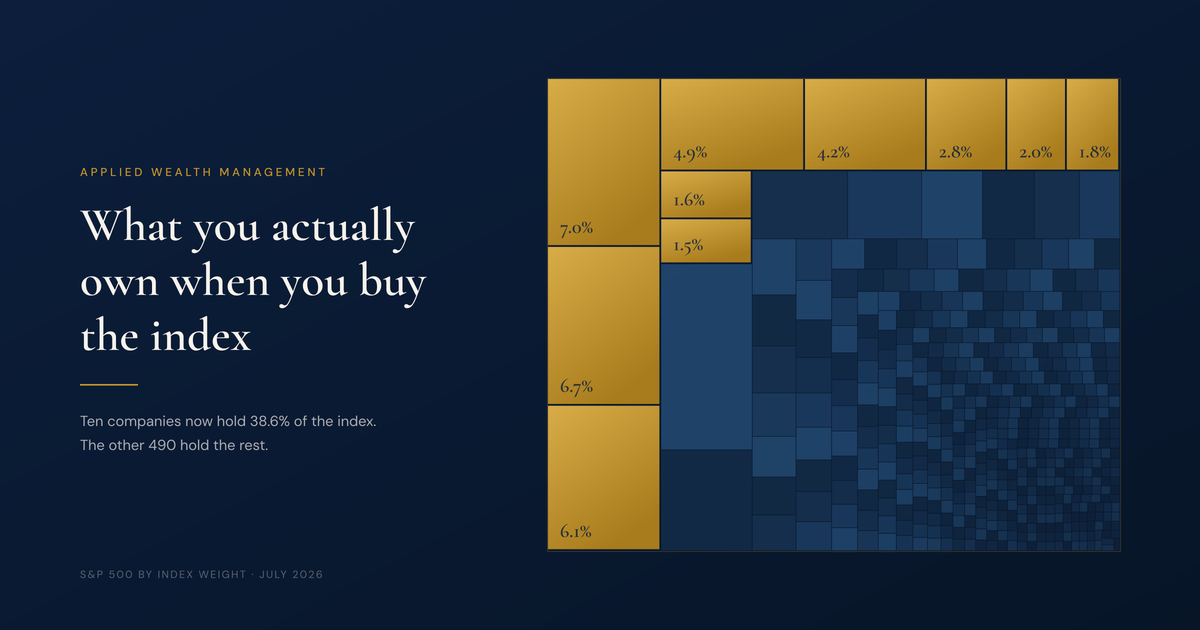
The ten largest positions in the S&P 500 account for roughly 37% of the index by weight. Counting Alphabet's two share classes as a single company, the ten largest companies are closer to 39%.
Concentration peaked higher. At the end of 2025, the top ten reached approximately 41% — a record — before easing during the first half of 2026 as mega-cap technology sold off and the rest of the index caught up.
For context, the top ten held roughly 27% of the index at the March 2000 dot-com peak and about 23% in 2000 overall.
Nvidia alone is near 7% of the index. Apple is close behind. Either one is larger than several entire GICS sectors.
Breadth has been narrow in stretches. Nomura's analysis of a 28-session run from late March to early May 2026 found ten stocks accounted for 69% of the index's gains.
The names differ, but the exposures do not. Semiconductors, hyperscale cloud, networking hardware, memory, power generation for data centers — the top of the index is largely one investment thesis expressed through a dozen tickers. Their revenues are increasingly linked to one another's capital expenditure budgets, which is a form of correlation that historical diversification statistics tend to understate.
Why this lands differently depending on the client
For a 34-year-old contributing monthly for thirty years, concentration is mostly noise. Volatility is the price of the return, contributions buy more shares when prices fall, and time resolves nearly everything. A low-cost total-market index fund remains difficult to improve on.
The calculation changes in three situations we see constantly.
Clients drawing income. Sequence of returns is the entire game in decumulation. A retiree who sells shares to fund living expenses during a drawdown converts a paper loss into a permanent one, and the recovery — whenever it arrives — arrives for a smaller share count. "The index has always come back" is a true statement about the index. It is not a statement about a portfolio being drawn down while it waits. Concentration matters here not because it changes long-run expected return, but because it widens the distribution of paths, and in decumulation the path is what you live on.
Clients whose exposure is larger than they think. Consider a 60/40 portfolio where the equity sleeve is entirely S&P 500. If the top ten are 38% of the index, then roughly 23% of the household's total net investable assets sit in ten companies. Now add the common overlaps: an S&P 500 fund in the 401(k), a Nasdaq-100 fund in the brokerage account, a large-growth fund in the IRA, and a target-date fund from a prior employer. Four holdings, one set of underlying names, four times. We routinely find households who believe they own thousands of companies and in fact have a quarter of their liquid wealth in a single theme.
Clients with concentrated employer stock. If your compensation, your restricted stock, your options, and your index funds are all levered to the same sector, your human capital and your financial capital are correlated. A downturn arrives as a portfolio loss and a job risk simultaneously. This is the version of concentration risk that does the most damage, and it is almost never visible on a single account statement.
What to do about it
The response is not to time the rotation. We have no idea when or whether mega-cap technology gives back its leadership, and neither does anyone quoting a Shiller CAPE ratio at you. The response is structural.
Measure what you actually own. Aggregate every account — employer plans, brokerage, IRAs, old 401(k)s, deferred compensation, employer stock — and compute look-through exposure to the top ten names and to the AI infrastructure theme as a single unit. Most of the value in this exercise comes from simply seeing the number.
Decide the weighting scheme deliberately. Cap weighting is a choice. Equal weighting, fundamental weighting, and factor tilts are also choices. Each is a rules-based approach with a different set of exposures, and each will spend years looking wrong. Equal weighting, for instance, has outpaced the cap-weighted index so far in 2026 after several years of lagging badly — which is exactly the pattern that causes investors to adopt it at the wrong moment. Choosing a weighting scheme is defensible. Chasing whichever one led last quarter is not.
Separate the money that funds withdrawals from the money that funds growth. The purpose of a cash reserve, a bond ladder matched to near-term liabilities, or a contractually guaranteed income floor is not to raise return. It is to remove the requirement that you sell equities on the market's schedule rather than your own. If the first five to seven years of retirement spending is funded from assets whose value does not depend on the top ten names, index concentration becomes a long-term question rather than an immediate one. This is the substance behind our tagline: income that is engineered rather than harvested.
Rebalance on rules, and mind the tax bill. Concentration builds through appreciation, which means unwinding it usually means realizing gains. Trimming into charitable gifts, donor-advised fund contributions, exchange funds, low-income years, loss harvesting elsewhere in the portfolio, or step-up planning where appropriate — the tax path often determines whether reducing concentration is even worth doing.
Accept the tracking error before you sign up for it. Any deliberate move away from cap weighting will, at some point, underperform the headline index that gets quoted on the news, possibly for years. If you are not prepared to hold the position through that stretch, the diversification will not survive contact with a bad twelve months, and you will have paid the costs without collecting the benefit.
The other side of this
We would rather state the counterargument than have a client find it elsewhere.
Concentration is not new, and it is not automatically fatal. Markets have run top-heavy for extended periods and continued to compound. Today's leaders, unlike many in 1999, produce very large amounts of actual cash. Predictions built on concentration ratios have a poor track record for timing anything, and investors who de-risked at the 2023 concentration warnings gave up a great deal of return. Alternatives to cap weighting carry higher turnover, higher fees, and their own concentrations — equal weighting is a persistent bet toward smaller companies and away from momentum, whether the investor intends that or not. And every dollar moved out of a broad index fund and into something more specific reintroduces exactly the discretionary decision-making that the SPIVA data warns against.
Reasonable, well-informed people land differently on this. That is the point of publishing both sides.
The bottom line
The index is not a neutral default. It is a rules-based portfolio, currently weighted so that roughly four dollars in ten track ten companies levered to a single technology thesis. That may work out well. But it should be a position a household has chosen deliberately, sized against its actual timeline and income needs, and not one it has arrived at by accepting a slogan.
If you are within ten years of retirement, drawing income from your portfolio, or holding concentrated employer stock, we would suggest a straightforward exercise: total up every account and find out what fraction of your net worth sits in the ten largest names. Most people are surprised. If you would like help running that number and deciding what, if anything, to do about it, we are glad to.
Appendix: The SPIVA Scorecard at a Glance
Because we cite this data rather than paraphrase it, here is the underlying record. The figures below show the percentage of actively managed funds that failed to beat their category benchmark over periods ending December 31, 2025. Returns are net of fees, and funds that closed or merged mid-period are counted in the starting universe rather than dropped — which is the honest treatment, and the reason these numbers are higher than most fund-company marketing.
Fund categoryBenchmark1 Yr5 Yr10 Yr15 Yr20 YrAll U.S. domesticS&P Composite 15008091909395All U.S. large-capS&P 5007989869093Large-cap growthS&P 500 Growth96959298100Large-cap valueS&P 500 Value4183889387All U.S. mid-capS&P MidCap 4005572818490All U.S. small-capS&P SmallCap 6004163769090Real estateS&P U.S. REIT8497849091GlobalS&P World76959396—InternationalS&P World Ex-U.S.63809093—Emerging marketsS&P Emerging Plus5374889094
Figures are percentages, rounded. Source: SPIVA U.S. Scorecard Year-End 2025, S&P Dow Jones Indices LLC (data as of Dec. 31, 2025). Selected categories shown; 20-year data not reported for two international categories.
Five observations worth drawing out.
Single years are noisy; long periods are not. In 2025, large-cap growth managers had a 96% failure rate while large-cap value managers came in at 41%. That spread says more about which style the benchmark favored than about who was skilled. The columns to the right are where the signal lives.
The 15-year column has no exceptions. Across every reported category — U.S. equity, international equity, and fixed income alike — a majority of active funds trailed their benchmark over 15 years. Not one category produced majority outperformance.
Most of the funds did not survive to be judged. Of the domestic funds available at the start of the 15-year window, roughly half still existed at the end. Over 20 years, about 37% survived. Selecting a fund is not only a bet on performance; it is a bet on the fund continuing to exist in its original form.
Adjusting for risk makes it worse, not better. On a risk-adjusted basis, large-cap underperformance rises to approximately 98% over both the 15- and 20-year periods. Managers were not, in aggregate, compensating for weaker returns by taking less risk.
Bonds were no refuge in 2025. Roughly 82% of general investment-grade funds and 76% of high-yield funds underperformed. Emerging market debt was the single category where most managers beat the benchmark, at a 31% underperformance rate.
This is the evidence base, and it is the reason our portfolios are built primarily with index funds. The argument in this post is not with any of it. It is that this table tells you what not to pay for — it does not tell you how much of your retirement should sit in ten companies.
Applied Wealth Management is a fee-based registered investment advisor and insurance agency.
This material is for informational and educational purposes only and does not constitute investment, tax, or legal advice, or a recommendation to buy, sell, or hold any security or to adopt any investment strategy. Index and market data cited are as of July 31, 2026, from S&P Dow Jones Indices, published index constituent data, and press reports as noted, and are subject to change. Fund underperformance statistics are drawn from the SPIVA® U.S. Scorecard Year-End 2025, © 2026 S&P Dow Jones Indices LLC, with data as of December 31, 2025; SPIVA is a registered trademark of S&P Global, Inc. Figures shown are a condensed selection and are rounded; readers should consult the full report for complete data, category definitions, and methodology. References to third-party research are provided for context and do not imply endorsement. Indices are unmanaged, cannot be invested in directly, and do not reflect fees or expenses. Diversification does not guarantee a profit or protect against loss in a declining market. Past performance is not indicative of future results. Guarantees associated with insurance products are subject to the claims-paying ability of the issuing carrier. Any discussion of tax treatment is general in nature; please consult a qualified tax professional regarding your circumstances. Individual results will vary based on your specific situation.